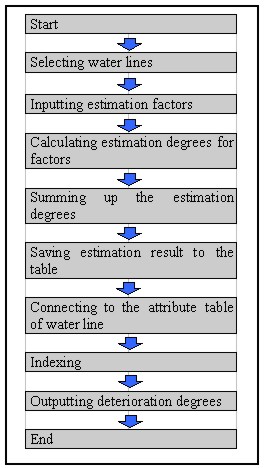
A DEVELOPMENT OF DETERIORATION ESTIMATION AND MANAGEMENT SYSTEM ON WATER LINES USING GISByounggil CHOI and Gyewoon CHOI, KoreaKey words: Deterioration estimation, Management, Water lines, GIS. AbstractDue to the fast industrial growth and unplanned urban underground development in Korea systematic management for underground utilities could not have been accomplished. Unsystematic underground utilities management has resulted in difficulty of finding exact location and the age of it, which has potential of leading it to a disastrous situation. Objective of this study is on the development of deterioration estimation and management system for water lines using GIS. This system is constructed to estimate easily water lines deterioration by the establishment of the geographic output system on it, search damaged objectives near surrounding area in a situation of destruction, and offer the information by which one can take quickly emergency. And also, it is constructed to prevent from accident occurring under work by presenting underground utilities and states of work. This system has largely two parts, deterioration estimation and efficient management of water lines. Deterioration estimation system evaluates its safety according to water lines deterioration and management system offers general information required for water lines management. Deterioration estimation model selected in this study is Numerical Weighting System developed by KOWACO(Korean Water Resources Corporation), which estimates quantitatively pipeline deterioration using factors such as year laid, materials, diameter, etc. Deterioration index tables were generated for the effective estimation, and they were applied on each water lines. DB for system application was designed by analyzing the task of water supply control center and deterioration estimation. This system is developed by using ARC/INFO of ESRI Company. 1. INTRODUCTIONDue to the fast industrial growth and unplanned urban underground development in Korea systematic management for underground utilities could not have been accomplished. Unsystematic underground utilities management has resulted in difficulty of finding exact location and the age of it, which has potential of leading it to a disastrous situation. GIS that has ability of storing, managing and analyzing various type of data has been fast expanded and been used in many fields with development of computer since 1980. Especially GIS is the system that has ability of integrating, managing and analyzing the voluminous graphic and text data, which is adequate system to manage complex network of the underground utilities of urban area2) 4) 7). The purpose of this study is focused on the development of deterioration evaluation and management system on water lines using GIS. This system has largely two parts, deterioration estimation and efficient management of water lines. Deterioration estimation system evaluates its safety according to water lines deterioration and management system offers general information required for water lines management. Deterioration estimation model selected in this study is Numerical Weighting System developed by KOWACO(Korean Water Resources Corporation), which estimates quantitatively pipeline deterioration using factors such as year laid, materials, diameter, etc. Deterioration index tables were generated for the effective estimation, and they were applied on each water lines. DB for system application was designed by analyzing the task of water supply control center and deterioration estimation model. And then proto-type deterioration estimation and management system are developed on the basis of studied model and designed database. Deterioration estimation system, characteristic output system, tracing system of damaged facilities, emergency information output system, and construction management system is constructed by using modules for efficient water line management. This system is developed by using ARC/INFO of ESRI Company.1) as main tool, and the basic date sets are owned by City of ChangWon. 2. DETERIORATION ESTIMATION MODEL FOR WATER LINESGenerally destruction of water lines is occurred on account of complex causes. In case of Japan, it is said that causes of water line destruction are largely pipeline deterioration and traffic load increase. In U.S. and Europe is emphasized soil movement as a reason. In this study, Numerical Weighting System developed by KOWACO (Korean Water Resources Corporation) to adjust to Korean environment has been used as pipe line deterioration estimation model. In this method, pipes were divided into 8 types according to diameter and materials6). (1) diameter 700mm and over (steel pipe), (2) diameter 700mm and over (cast iron pipe, ductile cast iron pipe), (3) diameter 700mm and over (concrete pipe), (4) diameter from 150 to 600mm (steel pipe) (5) diameter from 150 to 600mm (cast iron pipe, ductile cast iron pipe) (6) diameter from 150 to 600mm (PVC, PE, concrete pipe) (7) diameter 150mm and below (copper pipe, Stainless Steel pipe) (8) diameter 150mm and below (PVC, PE pipe) Also, estimation factor is classified into 19 types such as maximum water pressure (kg/cm2, on-the-spot survey), area of underground utilities (on-the-spot survey), road (on-the-spot survey), pipe type (on-the-spot survey), year laid(data analysis), a water leakage and accidental frequency (on-the-spot survey), anhydride rate(%, data analysis), soil resistance rate (W,cm, laboratory analysis), pH (laboratory analysis), redox potential (mV, laboratory analysis), sulphuric acid ion or chlorine ion (mg/kg, laboratory analysis), C value (on-the-spot survey), basement (on-the-spot survey), fulfillment (soil type, laboratory analysis), diameter (mm, on-the-spot survey), cathodic protection (on-the-spot survey), joint (joint method, on-the-spot survey), divergency (on-the-spot survey), junction (on-the-spot survey). In this method, the total score of deterioration by each estimation factors is score of 100 in maximum, the best condition of pipe and is score of 12-23 in minimum, the worst condition. A pipe under score of 60 has become antiquated considerably and should change, 60 and over to under 70 is also antiquated but it needs to watch with attention rather than immediate repair, 70 and over to under 80 is comparatively good state, and 80 and over very excellent. This method simply quantified water line deterioration and it makes easy to design and construct pipe line repair reasonably and economically, as estimating deterioration by various factors. However, data survey of various estimation factors should precede for real application. 3. DATABASE DESIGNMost database used in this system is owned by City of ChangWon and when necessary, we directly inputted and produced it. And database is designed to run each function effectively and it indexes to make the best use of GIS. It is important to study database format of GIS tool for database design because it is different according to the kind of GIS tool. For this study, ARC/INFO was selected and all DB sets were designed according to ARC/INFO specifications. Figure 1 is a process of deterioration estimation and database design follows these processes.
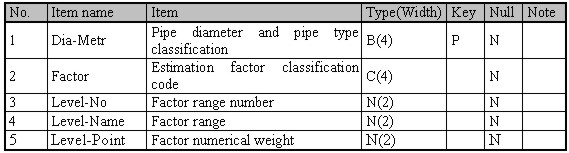
Figure 1. Flow chart of deterioration estimation Various data sets, owned by City of ChangWon, such as topographic (building, road, road facility), road network (street center line, intersection), land use, water line, and gas line maps were used in reference to the DB design, In addition, relational tables and reference tables were also designed. Relational table is drawn up using INFO Module of ARC/INFO to preserve continuously result data from estimating pipeline deterioration. Table 1 is estimation factor code table for deterioration estimation. Table 1. Estimation factor code table
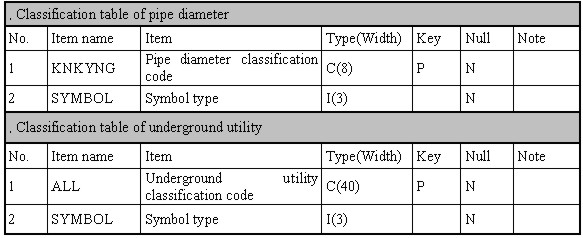
Lookup table can represent color or symbol of graphic output effectively3). Lookup table designed for this study are such as classification tables of pipe type, pipe diameter, year laid, accidental frequency, etc of underground utilities. Table 2 shows classification table of pipe diameter and underground utility. Table 2. Lookup table design
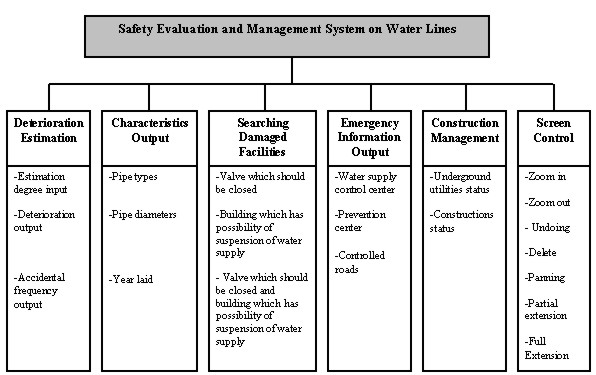
4. SAFETY EVALUATION AND MANAGEMENT SYSTEMThis system divides into largely 6 sub-systems and each sub-systems consists of 2~7 modules. Each modules are formed with items which should be applied to works directly by water line manager in a field. The structure of this system is equal to this.
Figure 2. Safety evaluation and management system on water lines Table 3. Function of safety evaluation and management system
1) Deterioration estimation systemDeterioration estimation system which is for evaluating water line deterioration consists of numerical weight input system, deterioration output system, and accidental frequency output system. Numerical weight input system can input estimation scores of various estimation factors about specific pipes. It is designed every kind of input screen differently each other, because there are numerical differences of estimation factors from 1 to 4 according to pipe type and pipe diameter described in chapter 2. Estimation factor code table and estimation factor classification table is drawn up in order to be appeared input screen automatically corresponding to that pipe, when user clicks specific pipe on screen. These two tables are linked with attributes table of water line coverage, therefore each pipes of them come to be linked with input screen according to 8 types divided in deterioration estimation model. Deterioration output system is constructed to link each pipelines with estimation result storage table and to know deterioration at a glance through index. If values of each factors were inputted into each pipe lines, deterioration degrees would output in different colors corresponding to each estimated values. Accidental frequency output system has ability to output accidental frequency in these five years. And accidental frequency is updated by input values of estimation degree input system on real-time. It is planned and drawn up relational table to connect with water lines coverage for indexing. Figure 3 is output screen of accidental frequency.
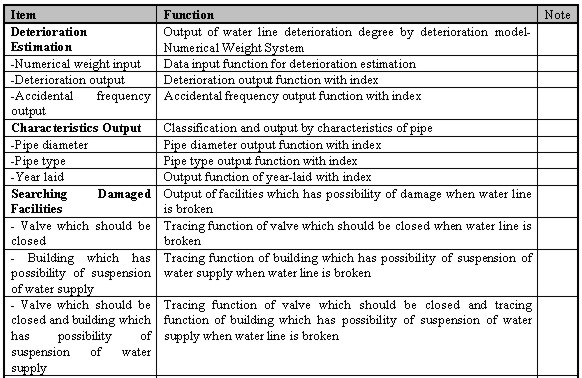
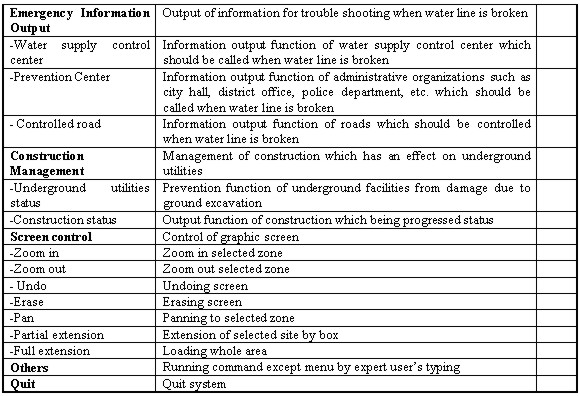
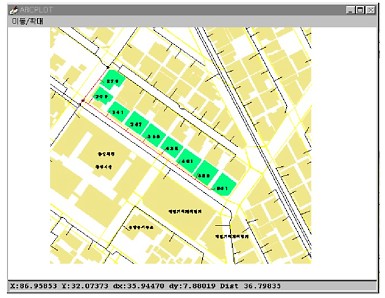
Figure 3. Output of water line accidental frequency 2) Output system of characteristicsOutput system of characteristics has functions to output pipes according to the types, diameters, years laid, etc. Output system of water line types has ability of outputting index for each water line types and showing the all water lines attributes. This system can output with their own number for each water lines, and connect the number with its corresponding water line attributes. Relational table is planned and written out to connect with water line coverage5). Output system of pipe diameters and years laid is able to classify and output pipes according to diameters and years laid. The lookup table of these systems are designed and drawn up. The lookup table is linked with water line coverage. Figure 4 is output of water line diameters.
Figure 4. Output of water line diameters 3) Damaged facilities trace systemSearching system of the damaged building traces a location where to lock a valve if water lines of a certain area were destroyed. And in case that a valve is locked, it presents blocked water line sections, damaged buildings, etc and shows attributes of damaged elements. Output system of valves which should be closed has a function of searching water line valves which should be closed, so that it outputs names surrounding buildings at the same time to represent locations of valves well. For this system, after valve branches are cut within a certain radius it uses network function of ARC/INFO. Output system of buildings which have possibility of suspension of water supply has ability of outputting buildings which have possibility of suspension of water supply with its attributes in a water line accident. It can output their own number of each buildings. And it considers that it is possible to make it contact with each buildings easily by outputting address and phone number of buildings using attribute values. For fulfillment of this system, a water pipe layer was created. And to search each buildings, buildings which are overlapped with water line layer within area of suspension of water supply are traced and outputted. Figure 5 is an output of valves which should be closed and buildings which have possibility of suspension of water supply.
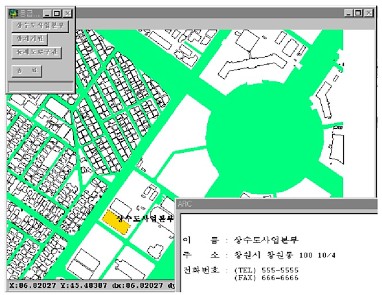
Figure 5. Valves which should be closed and buildings which have possibility of suspension of water supply 4) Emergency information output systemEmergency information output system which offers useful information to recover in accident of water pipe provides information of water supply control center, prevention center, the controlled road. The output system of water supply control center and prevention center can inquire information of organizations which should be contacted with to recover promptly damage of water line. Attribute information of each system can updated easily because it is constructed in text file separately not in attributes table of building layer. Figure 6 is an output of water supply control center.
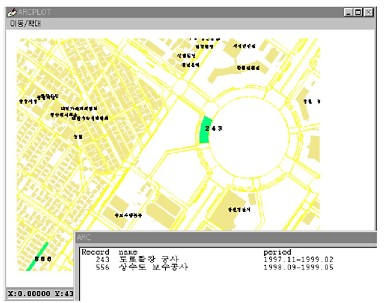
Figure 6. Output of water supply control center Output system of the controlled roads is able to inquire the controlled roads section of vehicles, etc. on account of water outflow in water pipe damage. 5) Construction management systemConstruction management system consists of output system of a status of underground facilities and construction. For fulfillment of this system special relational table is designed separately. Figure 7 is an output of construction status.
Figure 7. Output of construction status Construction status output system is possible to output a field of construction work and construction contents. It makes water supply control center to watch and manage water pipe accident under a construction work. Construction information is inputted in attribute table of roads, considering that the most water pipes are under roads. 6) Screen control systemScreen control system which controls graphics on a screen if user's need be, consists of zoom in, zoom out, undoing, deleting, panning, partial extension, full extension. 5. CONCLUSIONIn this study, Proto-type safety management system was developed which is easily usable if one has information about safety though not a professional worker. This system estimates water line deterioration considering various factors such as year laid, material, suspension frequency of water supply, etc. Therefore, this is rational and economical rather than estimating of deterioration and deciding replacement of pipe with one certain factor. And as it uses index, it can catch easily water pipe distribution according to deterioration. This system is able to search automatically valves which should be closed and buildings which have possibility of suspension of water supply in water pipe accident. And it outputs locations and attribute data of related organizations. These make it possible to take rapid emergency treatment. As this system offers data of the status of underground utilities, it prevents from accident occurring under every construction works. Also by inspecting construction status, safety of water pipe under works would be assured. This system is able to output graphic and attribute data of water line characteristics at the same time. Therefore, it can manage water lines more quickly and effectively. REFERENCES
CONTACTAssoc. Prof. Byoung-Gil, Choi Assoc. Prof. Gye-Woon, Choi 15 April 2001 This page is maintained by the FIG Office. Last revised on 15-03-16. |