THE PAMPA OF NASCA - DEVELOPMENT OF A MULTIMEDIA GISProf. Bernd TEICHERT and Christiane RICHTER, GermanyKey words: Multimedia GIS, Astronomy, Photogrammetry, Digital Terrain Model, Simulation, Animation, Datamodel. AbstractThe Nasca Lines and geoglyphs are one of the best known archaeological sites in South America, indeed the world. These large biomorph figures, long straight lines, and various geometric shapes were drawn on the surface of the desert near the town of Nasca beginning over two millennia ago. In 1995 the UNESCO added this area to the World Heritage List. The unanswered question that has historically aroused the most attention is: "Why were they created?" About 20 theories are current amongst scientists and pseudo-scientists but even today nobody is able to provide a comprehensive and scientifically provable answer to this question. One of the major theories deals with astronomical phenomena. In order to prove this astronomical theory a special research project was started by the department of surveying and cartography of the University of Applied Sciences in Dresden, Germany. The initial steps were the development of a special datamodel and the creation of a regional Digital Terrain Model (DTM). In September 2000 the photogrammetric data processing of the Nasca block (about 150 images) was started. This includes aerial triangulation, local DTM- generation, the extraction of lines and geoglyphs and the generation of ortho-images. Parallel to that the development of an astronomical approach was started. The presentation includes theoretical as well as practical aspects. We report about the current stage of the project. Especially, the datamodel and the astronomical concept will be explained in detail. In the practical part we will demonstrate some analyses and special animations using our GIS. Remarks: A quite similar article was presented at the International Workshop on Recreating the Past ~ Visualization and Animation of Cultural Heritage ~ in Ayutthaya, Thailand, 26 February- 1 March 2001. This workshop was organized by ISPRS Com. V. 1. INTRODUCTIONIn the south of Peru near the town Nasca between the Pacific Ocean and the imposing Andes extends a desert plateau called the "Pampa of Nasca", scene of a peculiar art gallery. An area of several hundred square kilometers is covered with large figures, geoglyphs and lines drawn in the rock strewn desert. Scientists attribute most of these drawings to the golden ages of the Indian "Nasca" culture (-200 - 800 AD.). Some figures measure over 200 m in length and the lines run up to 9 km. That's why they can only be properly viewed by eyes that are high in the sky. The traces were caused by removing the darker (oxidized) gravel of the desert's surface to expose the lighter (unoxidized) surface below. It is remarkable how these mysterious tracings have remained intact for so many centuries. This is due to a special geographic and climatic situation, which is unique to the Peruvian coast. For the last 50 years this archaeological site had been heavily damaged by human beings. The on-going destruction will hopefully stop now because UNESCO added this area to the World Heritage List in February 1995. In order to help to protect and preserve the historical drawings a special project has been set up by the University of Applied Sciences in Dresden. 2. MAJOR THEORIESThe question that has historically aroused the most attention is "Why were these drawings created?". Many theories are current amongst the scientists but even today nobody knows which theory is the right one. Here we have to distinguish between the popular literature and some serious scientific explanations. Nevertheless professional scholars generally believe that we do not have to pay attention to what popular literature has to say about these phenomena. A very good overview is given by (Aveni, 1990); he divided all the explanations into five distinct classes:
In our opinion the first class of those theories is doubtless of major importance. Paul Kosok called the Pampa of Nasca "The Largest Astronomy Book in the World". Unfortunately he never undertook a systematic survey of the lines for astronomical orientation. Late in 1941, Maria Reiche, a Dresden-born scientist followed his ideas and investigated the lines and the geoglyphs for more than 40 years and she found many lines and also geoglyphs which give evidence for astronomical orientations, (Reiche, 1993). Other scientists also tried to figure out the relationship with astronomy. The first seeming systematic approach was done by Hawkins in 1969, (Morrison, 1978). He concluded that the lines showed no solar, lunar, planetary, or stellar preference and that they "as a whole cannot be explained as astronomical nor are they calendric". Because of his special way of investigation several criticisms can be made and therefore the negative results cannot be regarded as the final word on any astronomical hypothesis for the origin of the lines. A much better study was done by Aveni (Aveni, 1990). He concluded: "In sum, then, were we to reformulate a hypothesis most consistent with the data, it would be a hybrid of the walking, the agricultural, and the astronomical hypotheses." 3. PROJECT DESCRIPTIONTo give an answer about the mysteries of Nasca, it would be important to have an interdisciplinary team of experts from disciplines like Geodesy, Archaeology, Astronomy, Agriculture, Irrigation, Ethnography, Iconography, Ceramics and Culture. Our primarily interest within this research project is the astronomical question in order to find evidence of the astronomical theory. Since we still believe that some of the lines and geoglyphs can be explained as astronomical or calendric, a computer simulation and animation will be developed as well. Last but not least the development of a special datamodel incorporating all the different aspects of the various disciplines by using a commercial GIS helps to solve those problems best. 3.1 Astronomical approachOne of the main parts of our project is the examination of the astronomical theory. Therefore the following components were defined:
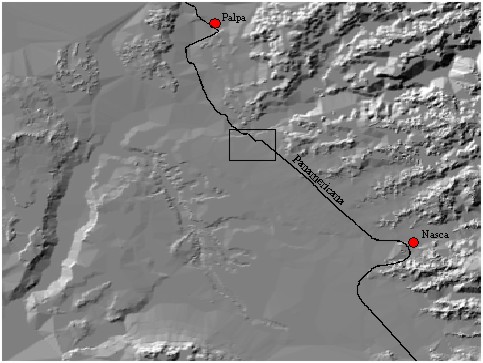
3.1.1 Regional DTM of Nasca A digital terrain model (DTM) of the whole area had been worked out by digitizing contour lines and single points by using existing topographical maps. The DTM was generated with the software "SCOP" (Schiefer, 1998). 3.1.2 Photogrammetric data capture The only practical solution to capture the geographical information of this area to a adequate accuracy will be a photogrammetric approach. Therefore the aerial photos (1:10 000) of the two photoflight missions in May 1997 and May 1998 are used; for more information see Grün et. al. (Grün, 2000). The aerial triangulation has already started and we expect to have the results by the end of February. After having solved the triangulation, the lines, geoglyphs and topographic data as well as data to generate the local DTM´s will be captured and automatically stored into the database. From the most interesting sites of the Pampa digital ortho-images will be generated. Zeiss (P3, Phocus, Phodis and BINGO) instruments and software are used.
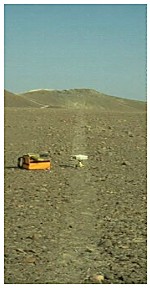
Figure 1. The computed regional DTM of Nasca and surroundings. 3.1.3 Tacheometric and GPS measurements In July and August 1996 fieldwork was done by members and students of the University of Applied Sciences Dresden. Nine of the well known geoglyphs had been captured by tacheometric measurements and 19 line centers by GPS. These geoglyphs as well as the line centers have been transformed into the Peruvian coordinate system (UTM Zone 18) via control points. Unfortunately the control points for the photoflights had been measured at a different epoch than the ones used in our fieldwork; so we need to transform all the coordinates into one common system.
Figure 2. GPS measurements (1996) at the Pampa of Nasca 3.1.4 Determination of azimuth and altitude of the lines In order to test whether the ancient lines in the desert near Nasca show a preference for the directions of the sun, moon, planets, brighter stars, or whether the lines show any deliberate alignment with a center of some ancient pattern of stars a fully automatic procedure (software program) has to be developed. Once we have the accurate geometry of the lines in our database, the azimuth and the altitude will be computed and stored as attributes. For these computations the local horizontal system of each line is used. The astronomical azimuth of the lines can be derived from the well known equations. For the computation of the altitude the regional DTM is needed because this angle is dependent on the surrounding landscape. These two angles of each line determine the astronomical direction within the local horizontal system of a possible rise or set of a celestial body.
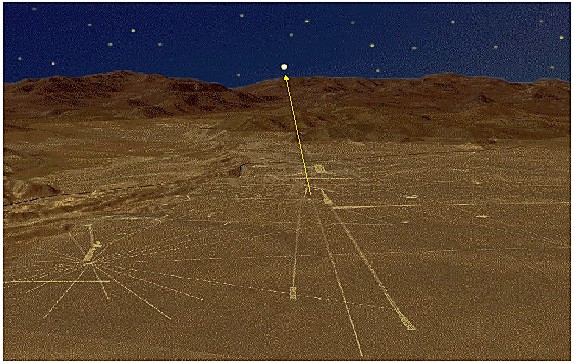
Figure 3. Computer simulation: Screenshot incl. the DTM, lines, geoglyphs and celestial bodies 3.1.5 Position of stars, planets, the sun and the moon The astronomical directions (azimuth and altitude) of the celestial bodies in the local horizontal system can be derived from the FK5-star-catalog and the JPL- Ephemerides. All the necessary transformations in between the different astronomical coordinate systems are well known and need not be described here. Low-cost-systems are also under investigation. 3.1.6 Correlation and conformity with celestial bodies To examine the correlation between the azimuth and altitude of the lines with the computed ones of the celestial bodies the following procedure is under development:
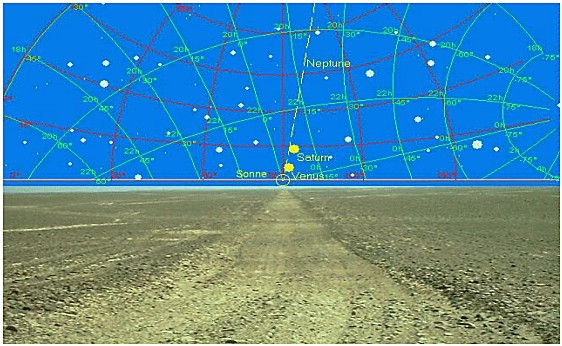
Figure 4. Correlation between the azimuth and altitude of a line with the computed ones of the celestial bodies (Schiebold, 1997)
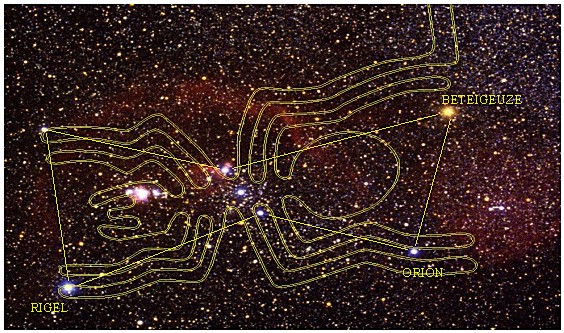
Figure 5. Conformity of the celestial constellations of stars (e.g. the Orion) with the geoglyphs (e.g. the spider) 3.2 Computer Simulation and AnimationAnother objective is the computer simulation and animation which finally will lead to a Multimedia-GIS. The simulation will show all the movements of the celestial bodies in relation to the virtual landscape of the area; this task is not yet under development. The idea is shown in figure 4. The animation ends in a video sequence, a virtual flight over the Pampa of Nasca. A screenshot is shown in figure 6.
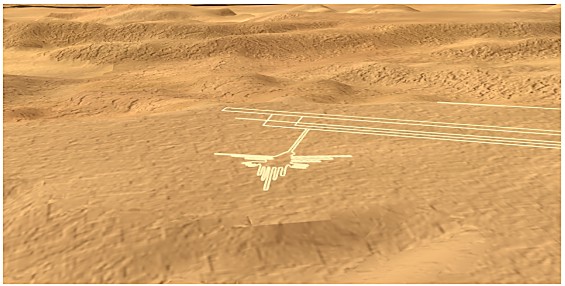
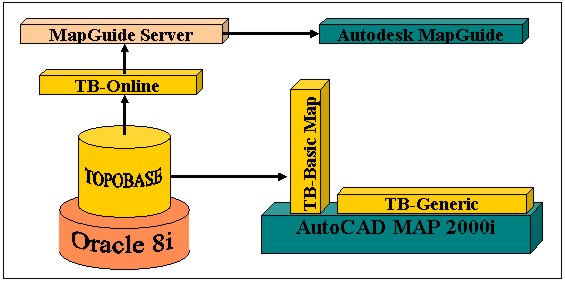
Figure 6. Screenshot of the virtual flight over the Humming bird 3.3 The Nasca datamodelThere is a need for a very special datamodel which includes the geometry and attribute data. All the necessary information about the lines, geoglyphs, areas, archaeology, astronomy etc. will be captured and stored into our GIS "Topobase", which includes Oracle 8i spatial and Autodesk products (Map 2000 and Mapguide).
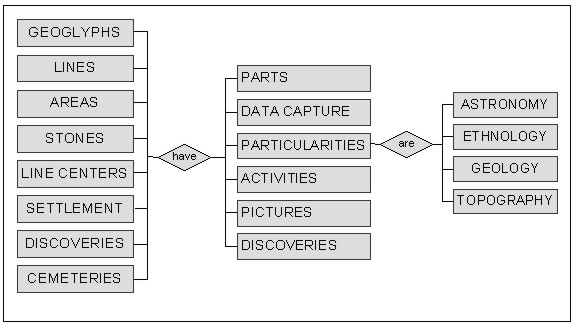
Figure 7. Configuration of the GIS "Topobase" The development of a spatio-temporal GIS would be necessary but its beyond of our scope. An intermediate state of the highly dynamic datamodel is shown in figure 8 in terms of an ER- Diagram.
Figure 8. Entity Relationship-Diagram The following data are already stored in the GIS-database respectively in SCOP:
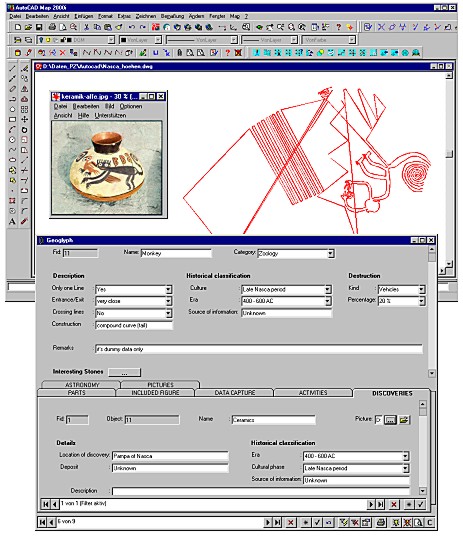
Figure 9 shows a screenshot of the implemented Nasca-GIS. There are two main windows: the graphical (AutoCAD Map 2000i) and the alphanumerical one (TB-Generic). Taking the monkey as an example: The first window gives the geometrical information and the second window shows the attributes. This window includes all tables of the Entity Relationship-Diagram in figure 8. The ceramic in the little window is one of the discoveries of the monkey.
Figure 9. Screenshot of the Nasca-GIS ACKNOWLEDGMENTFor sponsoring this project with the modern GIS "Topobase" we like to thank the German representatives of the international companies C-Plan (Mr. Markus) and Autodesk/Munich (Mr. Borchert). We are also very grateful for the support given by SLSA (Swiss-Liechtenstein Foundation for Archaeological Research Abroad), the ETH Zürich, M.O.S.S. Dresden and Quimico Suiza the representative of Leica AG in Lima/Peru. REFERENCESAllen, K.M.S., Green, S.W., Zubrow, E.B.W., 1990, Interpreting space: GIS and archaeology. Taylor & Francis, London Aveni, A., (Editor), 1990, The Lines of Nazca. Memoirs of the American Philosophical Society, Volume 183 Ebelt, E., 1999, Datenanalyse für das Nasca-GIS auf der Grundlage des RDBMS Informix and SICAD/open. Diploma Thesis, HTW Dresden, unpublished Grün, A, Bär, S., Beutner, S., 2000, Signals in the sand: 3-D recording and visualization of the Nasca geoglyphs. PFG, Vol. 6 Hagenberg, H., 1997, Aufbau und Erprobung eines DGM mit dem Programmsystem ER- Mapper. Diploma Thesis, HTW Dresden, unpublished Hawkins, G., 1969, Ancient lines in the peruvian desert. Special report No. 906-4 of the Smithonian Institute, Cambridge Morrison, T., 1987, Pathways to the Gods, the Mystery of the Andes Lines. London Mühlich, M., 1997, Entwurf eines relationalen Datenmodelles für das Nasca-GIS. HTW Dresden, Diploma Thesis, HTW Dresden, unpublished Reiche, M., 1968, Geheimnis der Wüste - Mystery on the Desert - Secreto de la Pampa. Stuttgart Reiche, M., 1993, Contribuciones a la Geometria y Astronomia en el Antiguo Peru. Lima Richter, K., 1997, Aufbau eines DGM für das Gebiet Nasca als Grundlage einer 3D-Simulation. Diploma Thesis, HTW Dresden, unpublished Schiebold, M., 1997, Digitale Erfassung der Linien und Figuren in der Steinwüste von Nasca/Peru. Diploma Thesis, HTW Dresden, unpublished Schiefer, T., 1998, Erstellung eines Digitalen Geländemodells für das Gebiet Nasca mit dem Programm SCOP. Diploma Thesis, HTW Dresden, unpublished Teichert, B., 1996, Conception of the Nasca-GIS. Proceedings of the FIG Commission 3 Seminar, Copenhagen Teichert, B., 1997, Die Nasca Linien - Zeit in archäologischen GIS. Tagungsband "Zeit als weitere Dimension in GIS" , Universität Rostock Teichert, B., 1998, The Nasca Lines - GIS Technology for Cultural Heritage. Proceedings of the FIG Congress, Brighton Teichert, B., Richter, Ch., 2001, The Nasca Lines and Geoglyphs - On the way to a Multimedia GIS. ISPRS Congress, Ayutthaya/Thailand, to be published Waberzeck, T., 1998, Erstellung eines Datenmodells für das Nasca-Projekt. Diploma Thesis, HTW Dresden, unpublished BIOGRAPHICAL NOTEProf. Dr. Bernd Teichert Dipl.-Ing. (FH) Christiane Richter CONTACTProf. Bernd Teichert and Christiane Richter 30 April 2001 This page is maintained by the FIG Office. Last revised on 15-03-16. |